Looking to up your data analytics game beyond Power BI? Explore the world of possibilities with these superior Power BI alternatives that redefine business intelligence.
From simple visualizations to powerful cloud integrations, find the best tools designed to meet your organization’s evolving data needs.
Whether you’re interested in flexibility, real-time insights, or seamless scalability, there’s a perfect match waiting to empower your data-driven decisions.
Embark on a journey to find the best alternative that transforms unstructured data into actionable intelligence like never before.
Power BI Features
- Self-service Power Query processes, transforms, integrates, and augments data for analysis.
- The natural language query tool allows you to ask questions in conversational language.
- Intuitive drag-and-drop interface and hundreds of data visualizations to create customizable, interactive reports and dashboards.
- Built-in connectivity and APIs for on-premise and cloud data sources such as spreadsheets, Salesforce, and Google Analytics.
- It integrates with Office 365 and other business tools for cross-organizational sharing and collaboration.
- Put reports and analytics on your blog or website.
- Power Apps and Power Automate automate business processes.
- Build machine learning models to generate insights from structured and unstructured data, including text and images.
- End-to-end encryption, real-time access control, and management of usage and access.
- Pro users can submit tickets for free support.
Power BI Limitations
- Steep learning curve: Engineers need to learn DAX to provide setup and support for non-techs. End users often need a day or more of training to use Power BI dashboards and reports.
- With so much variety, it’s hard to know where to start and what to focus on.
- It’s designed for MS, so it’s not Mac-friendly.
- It can be slow in processing large data sources.
- Unless recipients also have Pro, you need a premium license to share outside of your organization.
10 Best Power BI Alternatives
1. Tableau
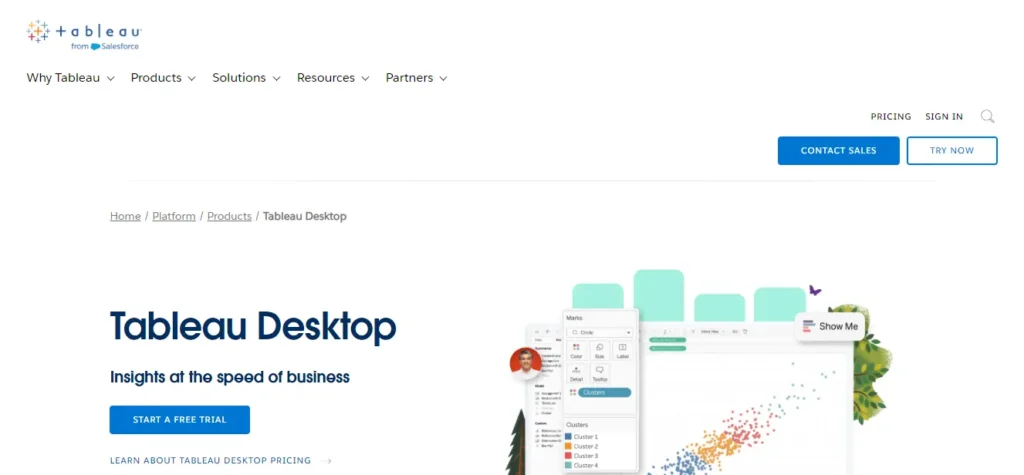
Tableau is a leading data visualization tool known for its interactive dashboards and ability to process large datasets. It allows users to access and share insights from data and create visualizations, dashboards, and reports.
FEATURES –
– Transport data mixture
– Real-time analysis
– Interactive dashboards
– Data connections
– Mobile-friendly
PROS –
– Highly interactive and intuitive
– Strong community and support
– Adaptability for large organizations
– Better mixing of data
CONS –
– Expensive compared to other equipment
– A steep learning curve for beginners
– Limited customization in the free version
2. Click Understand
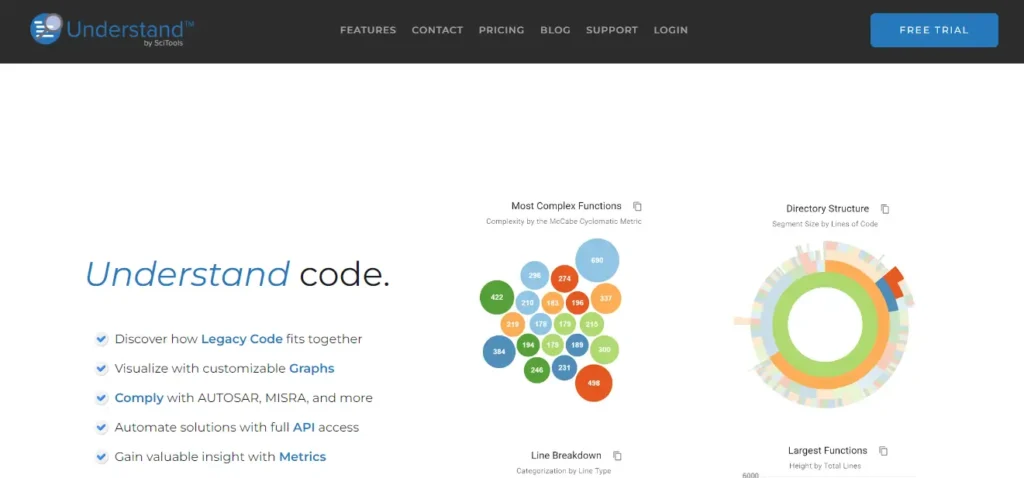
Click Understand is a data analytics platform that emphasizes self-service visualization and insights. It uses an associative data model so that users can easily find relationships in the data.
FEATURES –
– An associative data model
– A picture of self-service
– Comparison of data
– Collaboration
PROS –
– Very interactive and convenient
– A robust associative data model
– Strong mobile support
– Ideal for data analysis
CONS –
– A complex licensing system
– Find the necessary training
– Performance issues with big data
3. Luker
Luker is a business science platform that focuses on data analysis and discovery. It integrates closely with Google Cloud and provides customizable dashboards and built-in analytics for better data-driven decision making.
FEATURES –
– Data analysis and discovery
– Integration with Google Cloud
– Customizable dashboard
– With embedded analytics
– Translation control
PROS –
– Strong integration with Google Cloud services
– Very adjustable
– Ideal for embedded analytics
– The data modeling layer facilitates data governance
CONS –
– Expensive, especially for small businesses
– Essential SQL knowledge
– Limited offline capabilities
4. Domo
Domo is a cloud-based business intelligence tool that provides real-time data integration and visualization capabilities. It has been designed to be user-friendly with features for interoperability and a large app market.
FEATURES –
– Cloud based
– Real-time data integration
– Social collaboration tools
– In-depth analysis of the application market
– Mobile phones
PROS –
– User-friendly and insightful interface
– Real-time data updates
– Strong interoperability
– Available prefabricated connectors
CONS –
– Needed for premium features
– Processing can lag with very large data sets
– Advanced learning for advanced features
Also Read : Most Profitable AI Business Ideas in 2024
5. Sisense
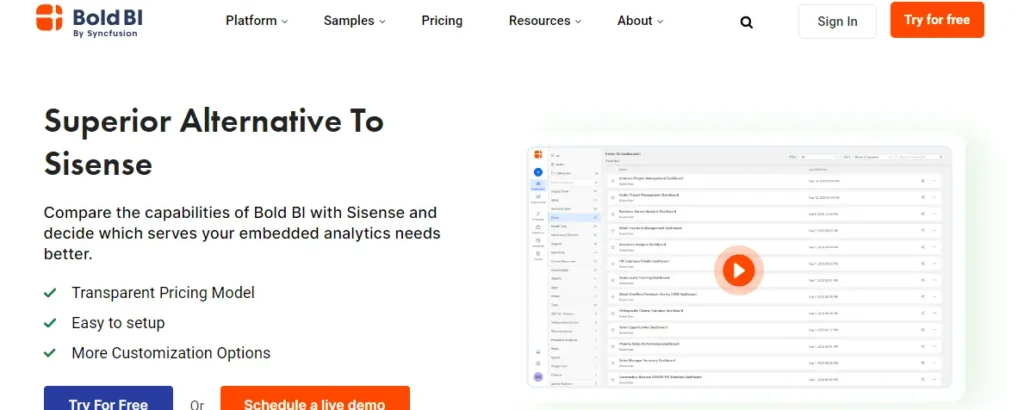
Sisense is known for its on-chip analytics technology that provides even faster performance on large data sets. It also offers data mashups, interactive dashboards and embedded analytics for comprehensive data analysis.
FEATURES –
– On-chip analysis
– A data mashup
– Interactive dashboards
– Data connections
– Embedded analytics
PROS –
– Fast processing using chip technology
– Easy to use for non-technical users
– Flexible and scalable
– Strong data integration capabilities
CONS –
– Costs can be prohibitive for smaller companies
– Initial setup can be difficult
– Limited advanced view options
6. SAP Workflow
SAP BusinessObjects is an enterprise-level business intelligence platform that integrates seamlessly with other SAP products including tools for creating enterprise reports, ad hoc queries, dashboards, and data visualizations.
FEATURES –
– Corporate reporting
– Ad hoc reporting
– Dashboards and data visualization
– Integration with SAP ERP
– Multi-source data integration
PROS –
– Ideal for enterprise-level reporting
– Strong integration with other SAP products
– Flexible and robust
– Advanced safety features
CONS –
– Expensive and complex for licensing
– The best learning experience
– Seek significant IT participation
7. MicroStrategy
MicroStrategy is an analytics and navigation platform that enables advanced analytics, data discovery, and mobile intelligence. Known for enterprise-grade security and scalability.
FEATURES –
– A high level of analysis
– The snowflake
– Providing mobile intelligence
– Embedded analytics
– Enterprise-grade security
PROS –
– Intensive searchability
– Good mobile support
– Adaptability for large organizations
– Strong protection
CONS –
– with higher costs
– Difficult to operate and maintain
– Require appropriate training
8. Zoho Analytics
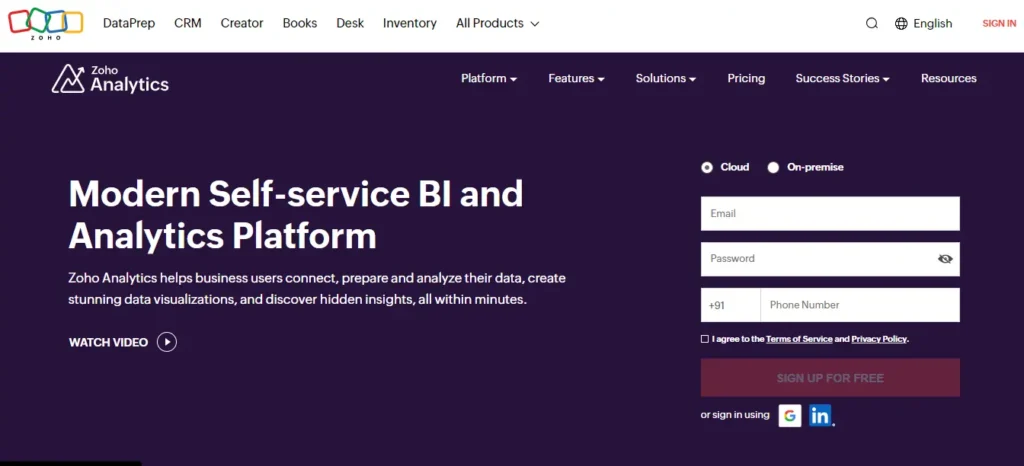
Zoho Analytics is an automated BI and analytics platform that provides data blending, AI-driven insights, and interactive dashboards. Suitable for small to medium sized affordable projects.
FEATURES –
– Transfer data mixture
– AI-driven search
– Interactive dashboards
– Data connections
– Collaboration
PROS –
– Ability to help
– User-friendly interface
– Strong AI and machine learning capabilities
– Ideal for small and medium businesses
CONS –
– Limited options
– Performance issues with big data
– Less growth compared to competitors
9. Google Data Studio

Google Data Studio is a free tool for creating interactive dashboards and reports. It integrates seamlessly with other Google services, making it easy to view data from sources like Google Analytics and Google Sheets.
FEATURES –
– Real-time data integration
– Interactive dashboards
– Collaboration
– For Google service integration
– Free use
PROS –
– Free and easy
– A seamless integration with Google products
– Easy to use and share reports
– Ideal for small businesses and freelancers
CONS –
– Improved accreditation
– Less powerful than fancy machines
– Can be slow with large data volumes
10. IBM Cognos Analytics
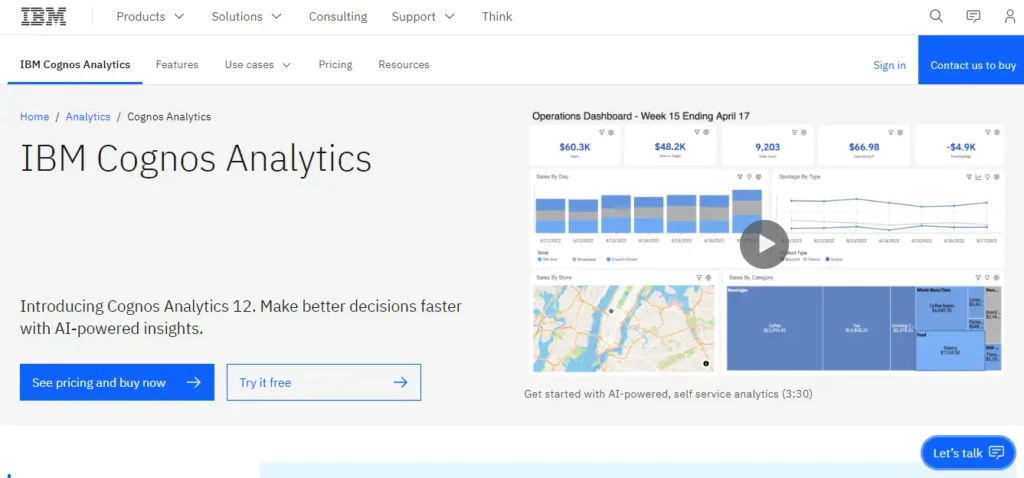
IBM Cognos Analytics is an AI-integrated business intelligence platform that provides advanced analytics, data preparation and interactive dashboards Designed for large enterprises with a focus on scalability and security.
FEATURES –
– With detailed analysis
– Rolling data
– Interactive dashboards
– AI-infused insights
– Adjustable for larger projects
PROS –
– Integration of powerful AI and machine learning
– Providing comprehensive reporting and analysis
– Adaptability for large organizations
– Robust security and compliance resources
CONS –
– High cost and complicated licensing
– Significant training and IT support required
– Steep learning curve for new users
CONCLUSION
When considering Microsoft’s Power BI alternatives for business intelligence and data visualization, several strong options emerge, each meeting needs and preferences.
Tableau stands out for its flexible interface and powerful visualization capabilities, making it a top choice for in-depth data analysis. Qlik Sense offers a unique association model that allows users to analyze data from multiple sources, providing a deeper understanding of the underlying dynamics. With its strong integration with Google Cloud, Looker offers scalable solutions for businesses using cloud services.
For those looking for an open alternative, Apache Superset offers flexibility, albeit with a steep learning curve. Ultimately, choosing the best option depends on specific business requirements, such as ease of use, integration, scalability, and budget. Organizations should consider these factors in choosing a BI tool that aligns with their business objectives and improves the effectiveness of their data-driven decision-making process.
FAQ’S
1. What are the top options for Power BI?
Top choices include Tableau, Qlik Sense, Looker, Apache Superset, Domo, Sisense, and Google Data Studio.
2. Can Google Data Studio be a free alternative to Power BI?
Google Data Studio is free, integrates well with Google products, and is suitable for basic to intermediate BI needs.
3. What should I consider when choosing the Power BI option?
Consider your business needs, budget, scalability, integrability, and ease of use.


